Shop

WinCT-Viscosity
Via RS232C, this software enables A&D’s Sine-wave Vibro Viscometer SV Series to display the progress of measurement in real time on a PC or easily transmit the measured results (data) to save or analyze. The CD-ROM of WinCT-Viscometer is equipped as a standard accessory of Viscometer SV Series.
RsVisco: Graphing software to create graphs of the measured results and the progress of viscosity measurement.
Highlights
Features
Downloads
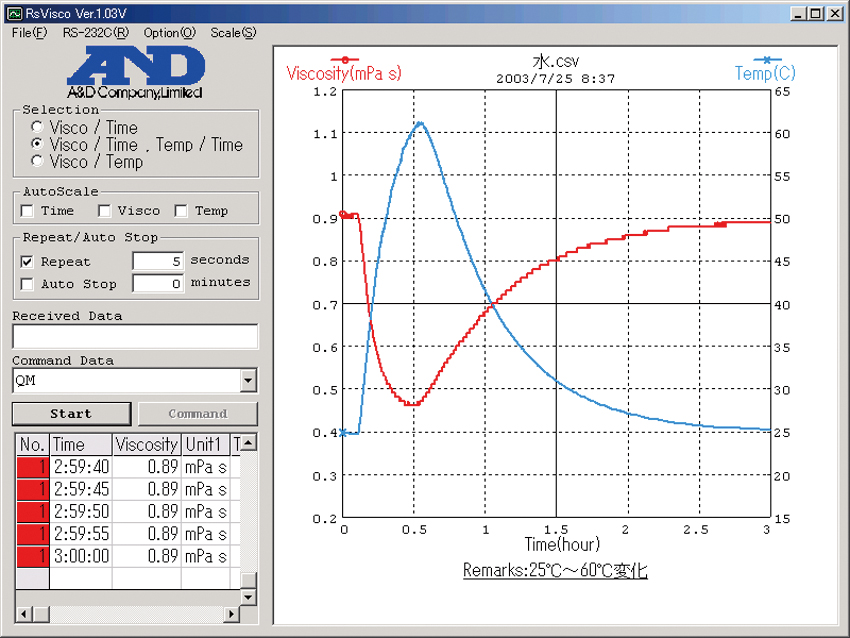
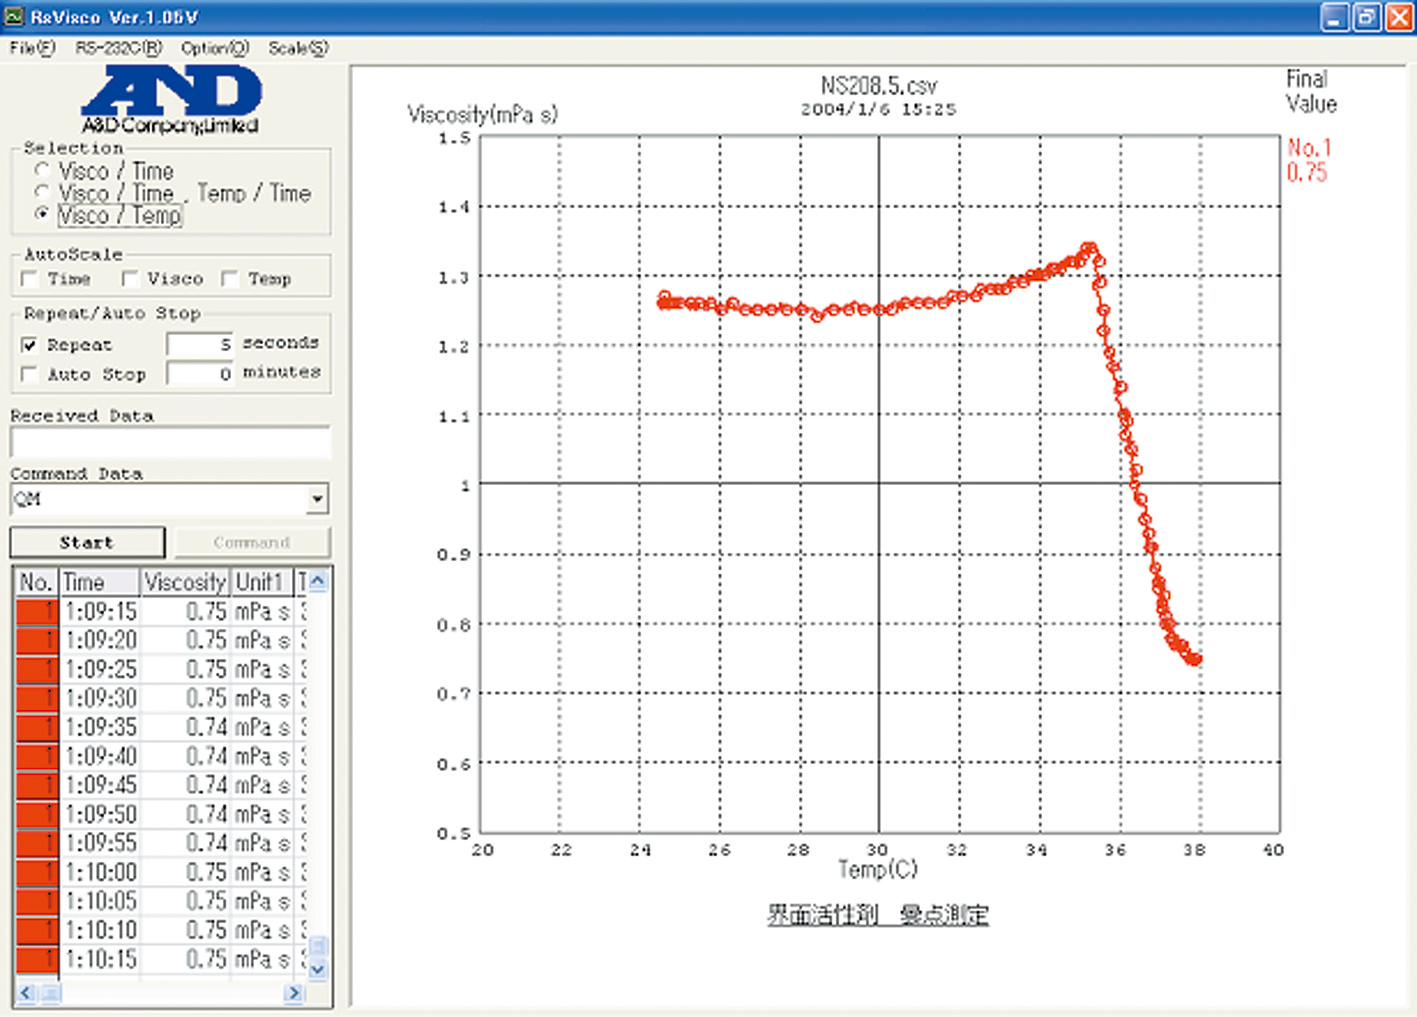
- Creates the real-time graph of data received from A&D’s Sine-wave Vibro Viscometer SV Series via RS-232C. Progress of change in viscosity during measurement can be monitored in a graph. Temperature data also can be simultaneously displayed, and the graph of temperature and viscosity can be monitored in real time.
- The following three types of graphs are provided to choose from;
Viscosity (Y axis) – Time (X axis)
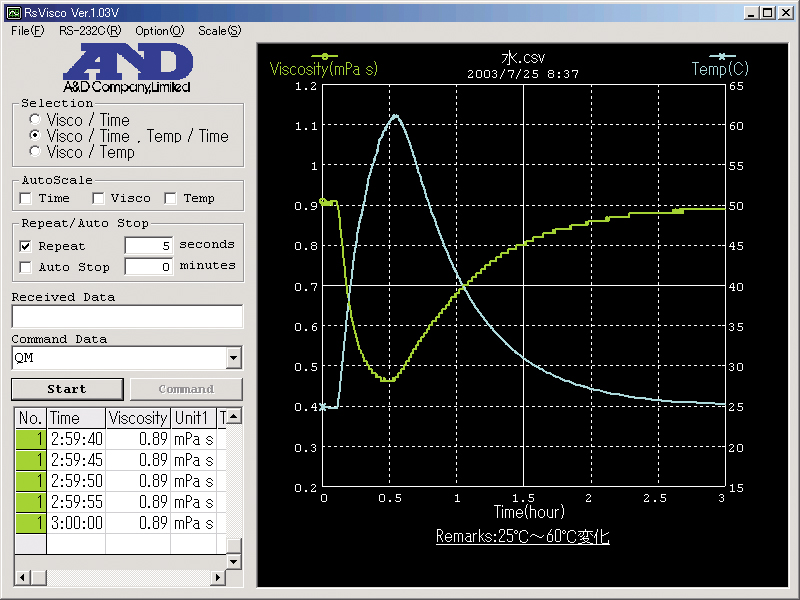
Viscosity/Temperature (Y axis) – Time (X axis)
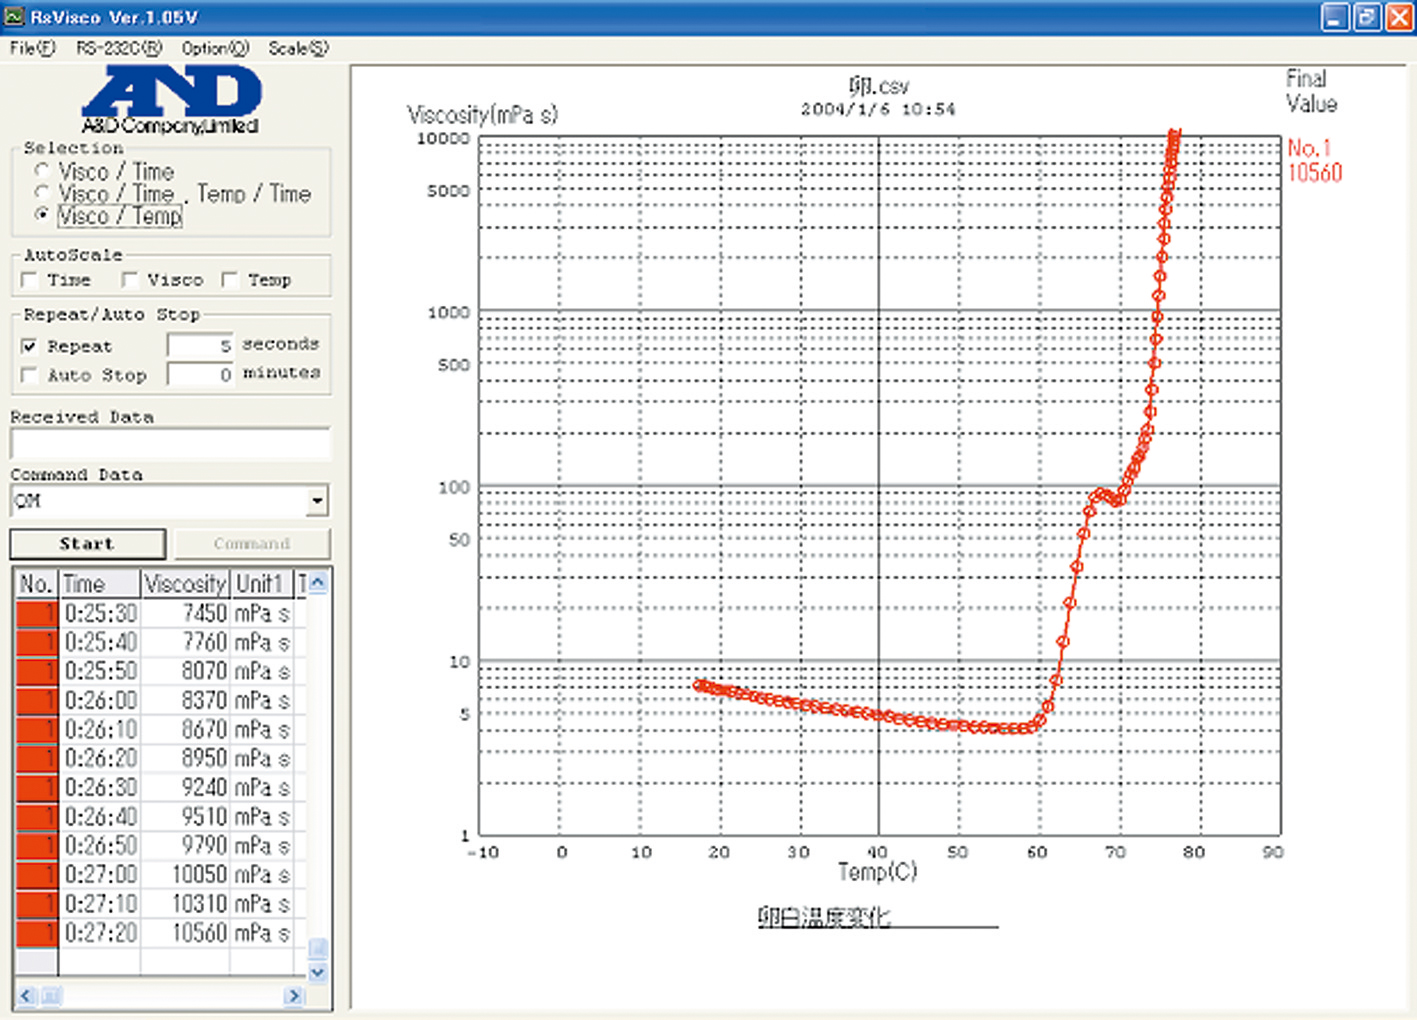
Viscosity (Y axis) – Temperature (X axis) - Graphs can be overlaid in repeating measurements. (in 10 colors)
- Measured data can be saved in a CSV format file.
- Displayed graph can be printed with a printer via a PC.
Highlights
- Creates the real-time graph of data received from A&D’s Sine-wave Vibro Viscometer SV Series via RS-232C. Progress of change in viscosity during measurement can be monitored in a graph. Temperature data also can be simultaneously displayed, and the graph of temperature and viscosity can be monitored in real time.
- The following three types of graphs are provided to choose from;
Viscosity (Y axis) – Time (X axis)
Viscosity/Temperature (Y axis) – Time (X axis)
Viscosity (Y axis) – Temperature (X axis) - Graphs can be overlaid in repeating measurements. (in 10 colors)
- Measured data can be saved in a CSV format file.
- Displayed graph can be printed with a printer via a PC.