
This is Part II of “Solutions provided by the BM Series”.
The BM Series of micro-balances went on sale in December 2010 (in Japan). There were 2 development objectives for this series: a standard anti-static function as a countermeasure against static electricity and verification of microgram-level measurement performance in the field. These 2 objectives can be considered proposals for solutions to potential problems in the field.
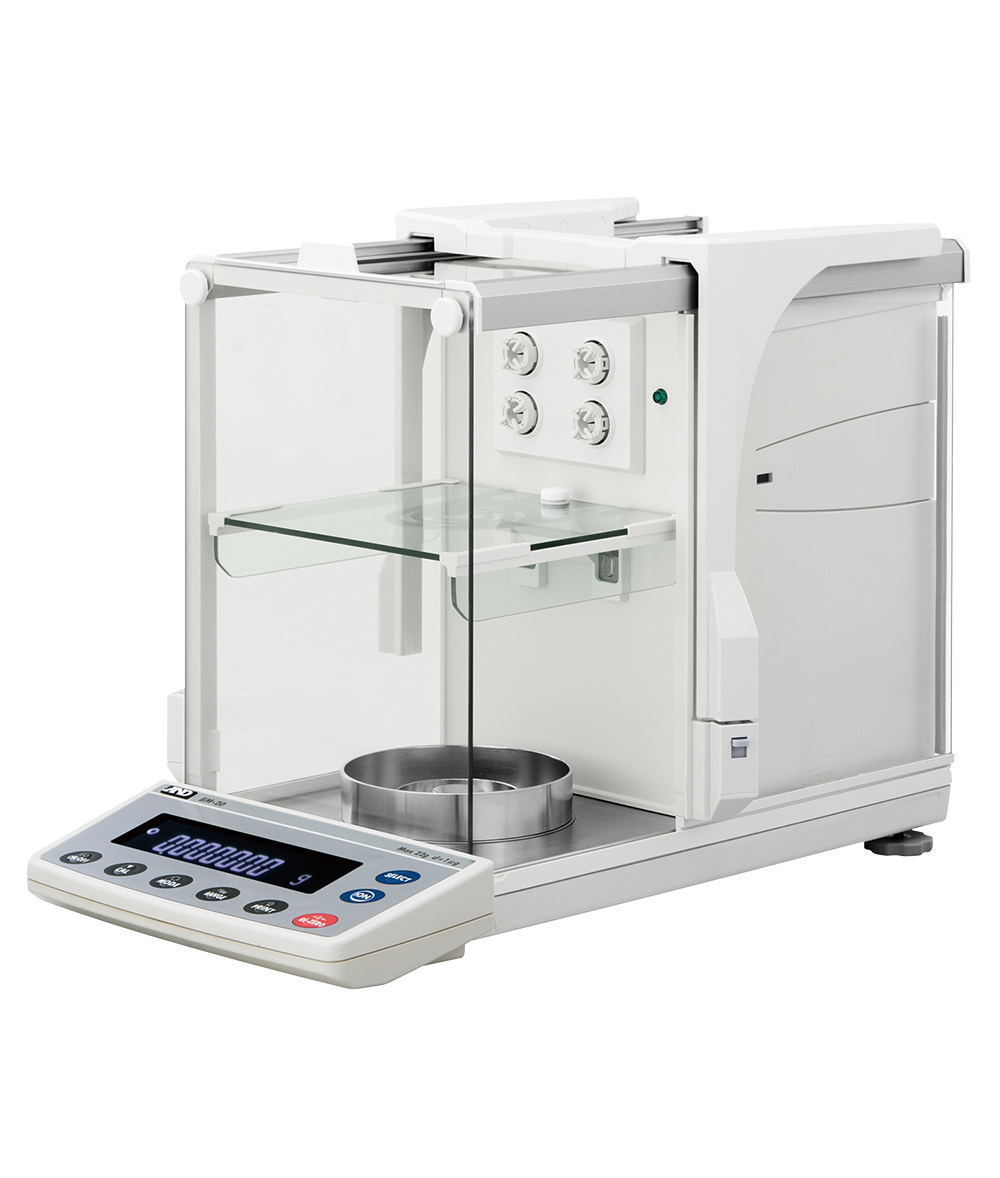
In the micro-balance market, the most important point in question is whether the measurement performance as specified by the catalog can be ensured (especially in the case of repeatability) in the environment where the balance is set up. For example, the BM-20 demands high precision and achieves a resolution of 1/ 20,000,000 with a capacity of 20 g and a minimum display of 0.001 mg. Because 1 μg is such a small mass, changes in temperature, humidity, or atmospheric pressure, slight breezes from air conditioning, and minute vibrations of support tables can negatively affect results. These external factors create instability in measurement values (particularly the zero point) at the microgram level and cause poor repeatability.
Problems pertaining to the setup environment stem from the fact that the micro-balance is so much more sensitive than its users and can detect minute environmental variations that users can’t. Since users can’t easily solve problems they can’t sense, they have a constant feeling of uncertainty about the balance. To eliminate this uncertainty in end users, we offered the Measurement Environment Evaluation Tool (AND-MEET) when the BM Series first went on sale and started to monitor actual usage environments.
AND-MEET constantly monitors the setup environment of the balance while simultaneously raising and lowering the internal mass of the balance automatically. With this tool, we were able to evaluate temperature changes and the corresponding repeatability of weighing values over time. Monitoring of the environment and weighing values helped us clearly identify errors that arise from the setup environment. It started to become clear that various issues caused weighing values to become unstable. These included large temperature fluctuations; minute repeated temperature fluctuations sensed by the balance caused by flowing air after users arrive at work and switch on the air conditioning (even when the room temperature is stable); pressure changes from opening and closing doors; and building movements caused by low-pressure drafts and distant earthquakes.
By pinpointing the causes of weighing errors, we were able to provide concrete methods to stabilize weighing values. These included introducing anti-vibration stages, setting up an external covering (breeze break) to reduce blown air from air conditioning, moving the balance away from locations where people are working and where vibrating analysis equipment is operating, and moving the balance to locations with minimal room temperature changes caused by outside air temperature. We were also able to evaluate the tangible effects of these measures.
I’d now like to discuss the measurement results acquired by AND-MEET. Figure 1 is a graph of temperature and measurement (zero point and span value (the weighing value minus zero point)) data taken over 24 hours from 5:00 PM Thursday, February 17 to 5:00 PM Friday, February 18, 2011 using a BM-22 micro-balance.

The balance was powered on at 5:00 PM on Thursday. The internal mass was automatically moved up and down in 40-second cycles and the ambient temperature, zero point, and weight were logged using the AD-1688 data logger. The ambient temperature rose from 19 to 22 °C over about 5 hours. The zero point also changed greatly after being powered on. From 11 PM on the 17th, the ambient temperature was comparatively stable, as was the zero point. Accordingly, the span value showed fewer fluctuations and stabilized.
From 9 AM to around 4 PM on the 18th, the temperature was quite stable, likely due to workers arriving and switching on the air conditioning. After 4 PM, there was a sudden temperature increase and the zero point and span value changed. This data was obtained at a university research lab that uses the balance. While the cause of the temperature changes could not ultimately be determined, the location can be described as a measuring environment with sudden temperature changes at certain times.
Figure 2 is a graph of temperature changes and the repeatability of the span value. Span value is calculated by subtracting the zero point from the weighing value. The repeatability of the span value is the standard deviation (σ) of 10 consecutive calculations.

Each point represents the standard deviation of 10 span values. The balance used to acquire the data was a BM-22, which is a micro-balance with a capacity of 5 g and a precision of 1 µg. Its specifications stipulate a repeatability of 4.0 µg with a 1 g counterweight.
From Figure 2, we can see that there were ambient temperature changes for around 6 hours after the balance was switched on and that the repeatability average was higher than 4.0 µg. After this period, it is clear that temperature changes were minor, the span value was stable, and the repeatability was at the specified level of 4.0 µg or less. After 5:30 PM on the 18th, the zero point changed due to another sudden room temperature increase and an accompanying worsening of repeatability was confirmed.
The graph provides supporting evidence for two important points when stabilizing balance performance: avoid sudden temperature changes and take sufficient time for the balance to warm up to thermal equilibrium before measurement. This is especially true for analytical balances. It is clear that it is possible to obtain measurement performance equal to catalog specifications with a micro-balance in this lab by eliminating the causes of the temperature increase after 5 PM or by measuring during the daytime, particularly in the stable measurement environment between 10 AM and 5 PM.
While the results have been omitted for space, AND-MEET confirmed worsening repeatability due to distant earthquakes and variation in repeatability over several hours due to low-pressure drafts. By providing this information, we were able to quantify the intangible anxiety users have always felt about the performance of analytical balances and also to later release the data in graphical form. This series of work has clarified problems with measurement environments and pointed the way to improved environmental setups and made it possible to measure stably with better precision. Through the abovementioned countermeasures, we hope to finally remove the doubt users have about using balances and improve usability in the workplace.