Automatic scale for animals(AD-1642A for mice)

Animal testing is used to accomplish the crucial task of evaluating the safety and effect of medicine before testing on humans occurs in the development process for new medicines. At facilities that perform these tests many tools ranging from balances for measuring weight to microscopes for observation are used for analysis.

In the past analytical experiments were commonly performed on animals to investigate the weight change of internal organs after medicine was administered as well as the biological responses of certain organs. However, an increased focus on animal welfare has led to a strong push toward reducing live dissections that accompany analytical experiments.

In recent years there have been ongoing attempts to measure the behavior patterns that indicate an animal’s health condition as well as changes in the voluntary activity of animals. This includes determining the behavior patterns and symptoms of the animal’s psychological state to try to see the effect of the drugs on the animal’s behavior. These methods are linked to the movement towards conducting appropriate evaluations and drawing proper conclusions on the effects of medicines including the mental state of a person when they are prescribed medicine.

It is becoming apparent that even when medicine is administered to people there may be psychological impacts that cannot be understood from only the response of the internal organs. Keeping this in mind, analyzing quantified phenomena such as animal behavior patterns and determining the effect of the medicine from those results is leading to methods for evaluating the comprehensive response on an individual or group of organisms.

Even though a medicine may cure a person’s illness it can also cause a reduction in that person’s quality of life (QOL) or in the most extreme case curing the disease may cause the person die. Recognition of these ideas is spreading among not only the pharmaceutical and medical industries but also among the general population.

In the past a device that measures the movement of animals by using the change in electrostatic capacitance was proposed as a way to measure animal behavior. Recently there have been attempts to quantify voluntary exercise using IR sensors and CCD cameras to capture animal movement.

Using these methods, digitized data from counting the number of movements between virtual areas on the floor of the animal’s cage and also from using light to count the movements between areas are used as the basis for measurement of voluntary exercise and the animal’s activity. However, quantifying animal movements observed from optical devices into digital data is a difficult problem among other problems such as poor measurement method compatibility and poor repeatability.

Many people have expressed the desire to measure both age-related weight gains of animals such as mice and weight changes caused by administering medicine all while measuring animal’s spontaneous movements over a period of time. There is a desire to make successive weight measurements on an animal without direct human intervention especially in the case of assessing the effect of pollutants on the body. Specific requests are increasing for improving safety issues with cross contamination such as with viral infections between humans and animals and improving experimental accuracy by lowering contact between people, the largest source of interference, and the test animal in the process for raising animals.

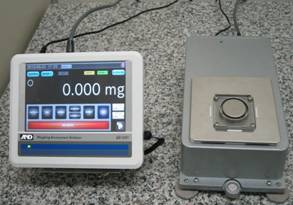
As a response to this latent demand we developed a scale that can automatically weigh mice and record the data. On this scale we placed a balance under the mouse’s cage and used a vertically extended pan support to place the balance pan the inside the cage.

By placing only the balance pan inside the cage, the measurement value when the mouse is on the pan (loaded value) and when the mouse is off the pan (zero point) can be calculated. By subtracting the zero point from the loaded value the weight of the mouse can be identified and by carrying out measurements over a long period of time data for weight change over time can be obtained.

Our newly developed automatic scale for mice is shown in figure 1.The balance for this scale is on the bottom, enclosed by a case. The mouse cage is placed on top of the case. There is a hole on the floor at the bottom of the cage. The balance pan goes through this hole as part of the structure inside the cage. The output from the scale is recorded as continuous measurement data and that data can be sent to a PC and analyzed. Additionally, wireless transmission of data is possible if the measurement environment permits.

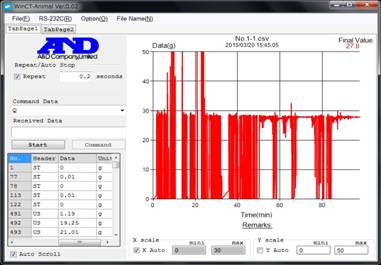
From the time-series monitoring of the mouse’s weight, that is measuring the time and frequency that the mouse is on the pan and also the amount of variation in its measured weight, we found that we could obtain not only the mouse’s weight but also important reference data for the amount of voluntary exercise and activity. Figure 2 shows data for a black mouse that weighs about 30g inside the cage for 90 minutes. On the graph the horizontal axis represents time and the vertical axis shows weight in grams. This mouse was full of curiosity and once inside the cage actively investigated the surrounding for the first 50 minutes. Afterward it stayed on the measurement pan and refrained from moving around much as shown in the graph. The graph shows the mouse’s weight on the pan as about 28g and displays zero grams when the mouse is off the pan. If, for instant, there was food or feces on the pan the mouse’s weight could still be calculated from the difference of the displayed weight when the mouse is on the pan and the “zero-point” weight.

Additionally, from being able to determine the frequency and amount of time that each mouse is on the pan and making some calculations an estimation of a mouse’s voluntary exercise amount is possible. Experiments with different mice put into the cage show large differences in the individual movements of each mouse.

Weight change for black mouse in cage for 90 minutes
Fig.2 Weight change for black mouse in cage for 90 minutes

With our newly developed automatic animal scale the previously difficult task of conducting sequential weight measurements is now possible. Furthermore, it was determined that by monitoring the change in weight over time, it is possible to evaluate the effect of medicine and other materials on animals. I believe our scale can be used as a device for measurement and analysis in fields outside medicine evaluation, for example, evaluating an animal’s individual activity levels, analyzing behavior patterns, and evaluating the effect of habitat aspects such as food, water, temperature, humidity, vibration, and wind on animals.

I would like to use this automatic measuring technology as a base to continue active development of various new products that can objectively evaluate the behaviors of animals.

Weighing instruments have a long history of use in part quality control and are recognized for their simple, cheap, and precise detection of defects including missing internal parts. Accordingly, precision balances were brought to the quality control and quantity management postproduction processes and have become essential for effective quality control. Next, from around 30 years ago general-purpose precision balances having 10 mg readability became more common mainly on bearing production lines. This was largely attributable to the fact that quick response balances with response times as low as one second came about and realized takt times of one second required on production lines. Latent demand propelled development of new quick response balances which led to the ability to perform complete part inspections and an increase in the frequency of weighing instrument use on production lines.

In my third year at A&D, I brought the HX series, which I developed from a weight sensor, to the market with an extensive set of design specifications that mirrored the society of the late bubble period. The HX series was a highly-functional, high-priced product compared to the general-use balances of the time but was not well received by the post-bubble market and ultimately failed. Despite its failure the HX series was the only general purpose balance to achieve one second response time in the balance industry at that time. Ten years later in 2000 we developed the GX series, the second generation of successor to the HX series and traveled to demonstrate this new product to our customers at large companies. I was surprised to find that manufacturers frequently using the HX series were strongly opposed to the discontinuation of the series. It was here that I realized the extent of HX series adoption on production lines. I find it amazing that it took me, the development manager, the entire 10 year period from product launch until its discontinuation to realize such a simple thing.

This realization helped me understand the importance of frequently turning to the market. I reflected on the widely-used development stance of the time that offered little perspective on the outside world. Since then when the opportunity presents itself I do my best to visit the sites where the products are actually used. I also came to realize the difficulty of obtaining market information since our company did not do direct sales.

Today weighing instruments from the level of general purpose balances to that of analytical balances measuring units as low as 0.1mg have become commonplace on the production line. Also in the past few years devices that weigh to the millionth of a gram called micro balances present new opportunities for quality control on the production line.

Microgram sensitivity has become important in production for three reasons: (1) the saturation of the large liquid crystal market and the booming smartphone market have caused the amount of resist ink added to small liquid crystals to reach the 0.1 mg (100 μg) range, (2) the miniaturization of electronic components has led to a reduction in the amount of IC sealant and soldering paste, and (3) there has been further miniaturization of bearings for storage and other devices. Behind all of this is the far-reaching issue that for Japan to survive in new markets it must guarantee superior quality control for its products.

In the situation described above, Japan, Korea, Taiwan monopolize the design and construction of production lines containing weighing instruments and the final placement of the line is almost inevitably China.

Many experts understand that microbalances display values tend to be unstable. However regarding why they become this way the common answer vaguely states the high sensitivity of the device is the source of the instability and doesn’t specify any further sources. This reality created a situation in which even when the sources of instability needed to be remedied where these balances are used, no corrective action could actually be taken, leaving the manufacturers of the balances to find a solution themselves. Nevertheless, the industry has long seen no manufacturer or balance related technological report that proposed any reasonable solution to the problem.

It is a contradiction that weighing and measuring instrument manufacturers do not measure the environment where the device is placed. To remedy this we looked into this idea of measuring the measuring environment. As a result, we came up with the idea of first recording weighing data over a long period of time while simultaneously taking the temperature, humidity, pressure, and vibration data of the weighing environment, next calculating the repeatability from the consecutive weighing results, and then graphing the data in order to hit on the cause(s) of the weighing instability. Through the rather upside-down thinking of drawing on the instability of the balance itself to identify its environmental causes, we found that it was possible to determine all sources of instability through monitoring weighing and environment data for 24 hours. This method became the basis for our weighing environment evaluation tool called “AND-MEET”. Through using AND-MEET and collecting and analyzing data the following could be determined to influence measurement: far away events such as the recent earthquake in Nepal 5000 kilometers away and influence from tectonic movements on the global scale, closer sources such as turning the air conditioner on and off, movement of people and trucks, the passing of low pressure air, heat from devices like electric furnaces placed in the room, and structural issues in the building where the measurement instrument is placed. After understanding the sources we could easily find ways to deal with them.

However, finding a way to handle instability caused by passing of a low pressure system proved to be our most difficult problem. Our newly developed device for production line weighing, the AD-4212D series, includes a model with a minimum display of 1μg and improved display stability. Display stability has been a problem with the existing products and fixing it was the most important of our development goals.

We were able to plan against disturbances such as temperature, humidity, and vibration. However, in our approach to correct issues caused by the approximation of a low pressure system we found that the standard deviation of the repeatability which should be 1.2 μg worsened to over 10 μg. We believed the source of this problem was the building being shaken by the strong winds accompanying low pressure systems. So we used the AD-1687 Environment Logger to repeatedly evaluate the environment. Unfortunately, there was no change in the vibration sensor, sensitive to one Gal. Even when there was no vibration in the building occasional instability in the weighing instrument was confirmed. The instruments were relatively stable during the summer but data taken a half year later in winter showed an increase in the frequency of instability. Finally, we identified that the wind speed as announced by the weather station itself would worsen the repeatability. However, even if wind blows directly towards the weighing instrument, with proper protection such as a breeze break there should be little effect. Furthermore there was no reason to think wind from outside could enter the partitioned rooms housing the balances.

In the end we found that minute pressure fluctuations inside the room attributed to the reported wind speed outside and pressure deviations caused by the airtightness of the casing for the weight sensor contributed to a variation in the instrument’s zero point. I plan to explain the details of our countermeasures for this problem at a later date, but after their implementation the new line of weighing instruments guarantees stable measurements at one microgram and ensures high precision with repeatability of 1.2 micrograms even if the wind speed is 4 m/s (or wind power 2) as shown in the attached graph. It has already been two long years of development for the AD-4212D.

A significant amount of time was required to ensure high stability at the one microgram level. Still, one technological breakthrough has eventually amounted into a tangible product as with the AD-4212D. I hope this weighing instrument, as a high stability analytical balance like none before, will effectively ensure the performance and quality of products manufactured on production lines and thereby contribute to productivity and quality improvements in Japan’s specialty of precision instrument production.

Fig1:AD-4212D Controller (display) and weighing unit
Fig 2:AD-4212D AND-MEET data
Repeatability at wind speed 4m/s averaged1.3 µg
AND-MEET and Earthquake in Nepal
    Fig3:AD-4212D AND-MEET data from time of earthquake

Fig 3 shows AND-MEET data for the 24 hours between 9:00 AM on April 25th and 9:00 AM on April 26th, 2015. Repeatability worsened due to the earthquake in Nepal but we confirmed no problems in balance function even with the maximum wind speed of 6.8 m/s.